Posted on 1 Comment

Aviation and climate change

C-141 Starlifter contrail. Image Courtesy of Wikipedia.org

We live in a world where there are growing concerns regarding human induced climate change. It is very high on the policy agenda of most governments, issues I have experienced first hand working as an environmental economist.   Not surprisingly, in the community it is generally accepted that we are without question experiencing climate change, and there is a consensus that a lot of it is human-induced due to increased carbon emissions.  It is not a debate, but a generally accepted consensus in the scientific community.
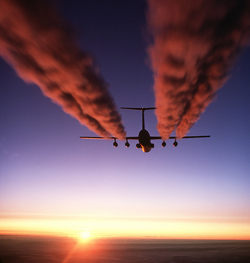
Global GHG Emissions By Source (2004). Image from US EPA website.

So like you, I love to fly and also love to travel by commercial air service.  How does commercial aviation contribute to climate change?  How do airplanes contribute negatively when it comes to greenhouse gas (GHG) emissions?

Let’s examine what the main contributors are to GHG emissions. Globally, the sources of GHG are primarily from energy supply (26%) and industry (19%). Transportation is close at 13%,  where fossil fuels are burned to power transportation activities such as rail, road, air and marine transport (IPCC 2007) and aviation represents about 12% of the transport figure.  The contribution of civil global aviation is about 2%  of total GHG emissions (CleanSky website). Flights produce about 628 million tonnes of Co2 annually.  A typical car emits about 5 tonnes per year and there are about a billion cars (Huffington Post 2013)  out there in the world (of course, this is a very rough figure) meaning about 5 billion tonnes are produced by cars, making it a greater net contributor. In Europe, road vehicles contribute about 1/5th of carbon dioxide emissions (European Commission 2012b).   In Canada, transportation accounts for over 28% of total GHG emissions (Conference Board of Canada 2010).  But what about per passenger kilometer?

The current rating for car is about 140 g / kilometer (European Commission 2012a). For air travel, this figure is higher, (2000 data) at about 170 g / kilometer (BBC news).   But the figures from aircraft vary extensively, depending on the type of flight, type of airplane used and distance flown.  Domestic short distance are as high as 260 g/km, domestic long distance 178 g/ km and long distance the lowest at 114 g / km (wikipedia.org). British Airways has estimated their per passenger rate at 100 g / km.  Flying trips cover far longer distances than could be undertaken by car, so total emissions would be higher because of the ability to travel longer distances.

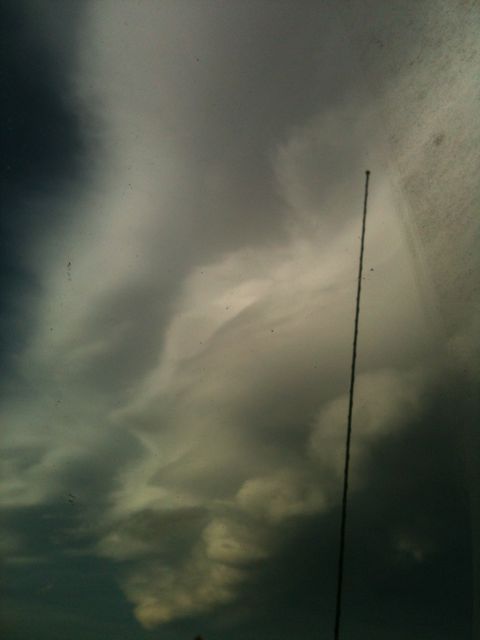
The effects of flights at high altitudes may be greater than those at low altitudes. An important effect appears to be from contrail emissions.

Cirrus clouds caused by jet contrails. Image from CO2 offset research.org

Remember from weather theory that jet engines produce contrails, which are mostly water vapor. One of the effects is that jet contrails cause cirrus clouds to form in the higher atmosphere where commercial jets fly (10-12 km above ground, at temperatures of -40). There still appears to be debate about what this contribution is to global warming, and most calculations are done from contributions of fuel burn.  However, a NASA study has found the warming effect caused by increased cirrus cloud formation from aircraft in the US (NASA 2004). Because of this, aircraft cause more than just CO2 emissions but also contribute to radiative forcing, which has to do with contrail production and nitrous oxide emissions.

These contrails are rare for low altitude aircraft or propeller driven aircraft, meaning the contribution of commercial aviation could potentially be more significant than other types of flights.

Another chief concern is the increasing use of air travel.  Since planes continue to run on fossil fuels, the increase in CO2 emissions from aviation will likely grow. In fact, between 1990-2004, number of airport users in the UK rose 120%. On average, global airline growth amounts to approximately 5% per year (MIT 2006).

Winglets on a Boeing aircraft. Image from Boeing.com

The industry is making changes to be more efficient. Experimenting with cleaner fuels (biofuels), aircraft made of composite materials that are lighter, and addition of aircraft modifications such as winglets or sharklets which block wing tip vortices (and reduce drag) are all being considered.  Wing tip devices, such as winglets or sharklets have been found to reduce fuel burn by as much as 3.5% (wikipedia.org).  Westjet’s 737 airplanes configured with winglets record a decrease of 2.7% fuel burn (Westjet website). The use of biofuels has it’s own issues – we see that with vehicles, where mandatory levels of ethanol (grain alcohol) in gasoline for vehicles has stressed grain markets -so these are being researched and considered. There are little things that can be done to reduce the impact.

It is an interesting issue.  A bit of food for thought!I am no expert in this field and your comments are welcome and appreciated.

Further reading and Sources can be found below.

BBC News (2000) “Pollution Warning on Holiday flights.

Clean Sky cleansky.eu webpage, “Aviation & Environment”

Conference Board of Canada (2010) “Greenhouse Gas Emissions

European Commission (2012a). “Co2 emissions from new cars down by 3% in 2011.”

European Commission (2012b) Climate Action. “Road Transport. Reducing CO2 emissions from vehicles.”

Huffington Post.ca. (2013) “Number of cars worldwide surpasses 1 Billion. Can the world handle this many wheels?

IPCC (2007) Intergovernmental Panel on Climate Change, Climate Change 2007: Synthesis Report.

NASA (2004) “Clouds Caused by aircraft exhaust may warm US climate.”

MIT (2006) “Global Airline Industry Program: Airline industry overview.”

US Environmental Protection Agency, EPA (2010) “Global Greenhouse Emissions Data.”

Westjet.com (2013) “Environmental commitment

Wikipedia.org (2013) “Fuel economy in aircraft.”

Wikipedia.org “Environmental Impact of Aviation

Posted on 8 Comments

Learning to Land

On approach for runway 34, CYBW

One of the hardest thing in flying is learning to land.  When I was struggling with the landing, my instructor made me feel better by letting me know this, and saying that she didn’t really “learn” how to land until she was doing her commercial license.  Of course she knew how to to it, but by that she meant that she didn’t really feel fully comfortable until then.

This put a few things into perspective, how long it will take until not only will it feel natural but you will not be so terrified and dry-mouthed every time you do it.  Since my first solo flight, I have really started paying attention how to possibly make the best landing happen consistently.  I haven’t been flying in the circuit much lately, so each flight I only get to do one of these landings so I try to make it as good as possible.

The landing sequence. This plane is about to flare.

One of the things that is very apparent is the amount of right rudder needed.  As you cut power to idle, and flare, you are operating the aircraft at very low power settings. Asymmetric thrust will cause the aircraft to want to yaw to the left: recall that the aircraft has left-turning tendencies which cause left yaw. This is actually what I noticed very clearly on my first solo flight, thinking it was the wind that was causing my nose to yaw to the left on landing, my instructor quickly corrected me that it was not using enough right rudder.

Four things will cause left -turning tendency. These are:

1. Torque reaction from engine and propeller

2.  Slipstream causing a corkscrewing effect of air hitting the tail on the right, yawing the aircraft to the left.

3.  Gyroscopic action of the propeller, the propeller is a gyroscope and tries to “spin” the aircraft the opposite way.

4.  Asymmetrical loading of the propeller at high nose attitudes.

On landing, asymmetric thrust causes the left yaw.  When you touch the ground, be prepared to add even more right rudder. The engine torque will cause the left wheel to carry slightly more weight than the right, increasing it’s drag and causing even more yaw to the left.

So how can you strive to make each landing perfect? I’ve made a list of steps that I think are very important to note:

1.  Check winds. When flying in the downwind leg, when on final, or whenever you get a chance note the windsock so you know what winds you will be experiencing on the ground and on your final approach. Will you have a crosswind?

2.    Approach at a constant airspeed for your configuration (whether using flaps or not), do not “chase” the airspeed: that is, do not focus your attention on the airspeed indicator and try to correct deviations by switching attitudes.  Establish your airspeed well in advance on final, note how the horizon looks when you have reached the proper airspeed, and keep it there. Once you have your airplane in the right attitude, keep it there.

3.   Pick a spot on the runway. When you stare at this spot, this is where you will flare. It also allows you to break down your desired touchdown spot and keep you from focusing on the entire runway.

4.  Flare 5-9 meters (15 to 30 feet) from the ground.  Over time, you will “sense” where this point is. I learned that to recognize this point is to when the movement of the ground suddenly becomes very apparent, the whole landing area seems to expand, and the point where the ground seems to be coming up so rapidly that something must be done about it.

5.  Once you flare, wait for the sink.  You are trying to bleed off airspeed.  Once you feel the sink, pull back more, just don’t pull back more before you feel the sink. This will cause the aircraft to balloon – gain lift – and the high nose attitude can cause you to stall when still too high above the ground resulting in a hard landing.   You need to cover up the runway with the nose of the aircraft to get the proper high nose landing attitude.  It will feel uncomfortable at first – it did for me.  This will allow you to avoid touching down with your nose gear, or having a ‘flat’ (three wheel) landing, which increases the risk of wheelbarrow. Pull back slightly each time you feel a sink, this will allow you to check your rate of descent until all flying speed is lost and you can touch the runway as lightly as possible.

6. Get in the habit of keeping your hand on the throttle throughout the landing. If something happens, for example if the landing is not going well and you need to overshoot or if there is something else wrong and you require application of power, the time to get this power if your hand was not on the throttle is too long.

There are four different kinds of landings:

  1. Normal landing
  2. Cross-wind landing; where wind inputs will be needed
  3. Short field landing, and
  4. Soft field landing.

We learn each landing and we practice all of them until they present no difficulty.

Posted on

Convert an FAA certificate to a Canadian private pilot license

Pre flight check on a Cesna 172

A little while ago someone asked us how to convert an FAA certificate to a Canadian Private pilot license.

Applicants are required to write a conversion examination consisting of several topics that have mainly to do with Canadian air law. Regulations should be reviewed as they apply to airplanes in VFR operations.  These are found in the table below.

CARS – are Canadian Aviation Regulations and found on Transport Canada’s website. The AIM is the Aeronautical information Manual and may also be found on the TC website, and you can download a a pdf copy of the publication.

Below are the specific subjects that need to be studied for the exam.

CARs Part I, Subpart 1 GENERAL PROVISIONS
101.01 – Interpretation (definitions as needed)
CARs Part IV, Subpart 1 FLIGHT CREW PERMITS, LICENCES AND RATINGS
401.05 – Recency Requirements
401.26 – Private Pilot Licence, Aeroplanes – Privileges
CARs Part IV, Subpart 4 MEDICAL REQUIREMENTS
404.04 – Issuance, Renewal, Validity Period and Extension of a Medical Certificate
CARs Part VI, Subpart 1 AIRSPACE
Division I – Airspace Structure, Classification and Use
Division II – Aircraft Operating Restrictions and Hazards to Aviation Safety
CARs Part VI, Subpart 2 OPERATING AND FLIGHT RULES
Division I – General
Division II – Operational and Emergency Equipment requirements
Division III – Flight Preparation, Flight Plans and Flight Itineraries
Division IV – Pre-Flight and Fuel Requirements
Division V – Operations at or in the Vicinity of an Aerodrome
Division VI – Visual Flight Rules
Division VIII – Radiocommunications
Division IX – Emergency Communications and Security
CARs Part VI, Subpart 5 AIRCRAFT REQUIREMENTS
Division I – Aircraft Requirements – General
Division II – Aircraft Equipment Requirements
TC AIM – GEN GENERAL
1.0  – General Information
3.0 – Transportation Safety Board of Canada
TC AIM – AGA AERODROMES
7.19 – Aerodrome Lightning – Aircraft Radio Control of Aerodrome Lightning (ARCAL)
TC AIM – COM COMMUNICATIONS
5.15 – Radio Communications – Phone Use During Radio Communication Failure
TC AIM – RAC RULES OF THE AIR AND AIR TRAFFIC SERVICES
2.0  – Airspace – Requirements and Procedures
3.6 – Flight Planning – Flight Plans and Flight Itineraries (Opening)
3.12 – Closing
4.0 – Airport Operations
5.0 – VFR En Route Procedures
TC AIM – SAR SEARCH AND RESCUE
3.9 – Emergency Locator Transmitter – Schedule of Requirements
TC AIM – MAP AERONAUTICAL CHARTS AND PUBLICATIONS
2.0  – Aeronautical Information – VFR
6.0 – Aeronautical Information Circulars – General
TC AIM – LRA LICENSING, REGISTRATION AND AIRWORTHINESS
3.9 – Pilot Licensing – Recency Requirements
TC AIM – AIR AIRMANSHIP
1.6 – General Information – Canadian Runway Friction Index
2.12 – Flight Operations – Flight Operations in Winter
Posted on

Air law – some basics

Studying air law requires a large double-double

I am currently studying air law.  Air law is a big topic and will take some time to cover.  It’s hard to present all this information, so I thought I’d review a few of the very basics.

Material for air law is found in the Canadian Aviation Regulations (CARS). CARS is divided into two parts, the Regulations, which provide the rules, and the Standards, which give us guidance on how to apply the rules.  There are eight parts, or subject areas:

Part 1   General Provisions

Part 2   Aircraft Identification and Registration

Part 3   Aerodromes and Airports

Part 4   Personnel Licensing and Training

Part 5   Airworthiness

Part 6   General Operating and Flight Rules

Part 7   Commercial Air Services

Part 8   Air Navigation Services

Canadian Airspace - Image from Transport Canada (tc.gc.ca)
Canadian Airspace – Image from Transport Canada (tc.gc.ca)

In Canada, airspace is divided into Northern Domestic Airspace (NDA) and Southern Domestic Airspace (SDA). The NDA runs in close proximity to the earth’s pole, and the lines of force dip towards the pole make the compass reading unreliable, because the compass lies in a horizontal plane.  Therefore, aircraft operating in this zone must fly according to true track calculations. Runway numbering is oriented to and surface winds are provided in degrees true. At night or IFR aircraft must be equipped with a gyroscopic direction indicator.

Runway numbering

In SDA, aircraft operate according to their magnetic track.  Runways are numbered according to their magnetic track, and surface winds are also reported in degrees magnetic. Runway markings are numbered to the nearest 10 degree increment, and the last digit is dropped. For example, runway with the heading 163 will be abbreviated 16.

Altimeter Regions

Canada is also divided into an altimeter setting region and a standard pressure region. The limits of the altimeter setting region are the same as for the SDA and vertically below FL180 (flight level 18,000 feet).  In this region, a pilot must set their altimeter to the current altimeter reading for the departing airport and airports along the flight.  The standard pressure region encompasses the NDA and anywhere above FL180.   The altimeter is set to standard sea level pressure (29.92″ Hg). For takeoff and climb for an airport in this region, altimeter should be set to the setting for that particular airport, and reset to standard pressure upon reaching cruising altitude.  For descent and landing, the altimeter setting for that particular airport should be set.

Uncontrolled Airspace

This consists of airspace where there is no air traffic control (ATC).  Because of this, aircraft in close proximity may present a hazard since to monitoring is given, hence pilots are required to monitor the frequency 126.7 continuously broadcast their location, altitude and intention.

Controlled Airspace

Here ATC is provided and consists of high level (above FL180) and low level airspace (below FL180).

High Level Airspace

All airspace above 18,000. This is divided into three regions: (1) Southern Control Area (SCA): same boundaries as SDA, within this area, all traffic (above 18,000 feet) is controlled, the (2) Northern Control Area (NCA) which extends from the northern limits of the SCA to about 72 degrees latitude, and all traffic above FL230 is controlled, and the Arctic Control Area (ACA) which extends from the boundary of the NCA to the North Pole. It controls all the airspace above FL270.

High level airspace includes high level airways which are prescribed tracks between specific navigation aids where ATC is provided, and high level air routes which are the same as airways but no ATC is provided.

 Low Level Airspace

This is Canadian Domestic Airspace below 18,000 feet ASL, not all of which is controlled. Controlled low level airspace includes

Low level airways: routes which aircraft can navigate by following a non directional beacon, and VHF/UHF airways spaced approximately 100 miles apart along the airway.  The basic width is 4 nautical miles on each side.  Low Frequency/Medium frequency airways (LF/MF) are navigated with reference to signals from low frequency transmitters. The width is 4.34 nautical miles on each side.  An airway has it’s base at 2,200 AGL and extends up to the base of the overlying high level airspace.

Control Area Extensions (CAE): are additional control zones established at some busy airports within controlled airspace to handle IFR traffic.  They extend from 2,200 to 18,000 ‘ AGL.

Control Zones: Designated around certain aerodromes to monitor IFR traffic and facilitate the movement of IFR and VFR traffic.  The upper limit is usually 3000′ AGL. They can be classified as B,C,D or E depending on the classification of surrounding airspace. Most with terminal control have a 7 nautical mile radius, others 5, and a few only 3.

Canadian Terminal Control Area (TCA) 
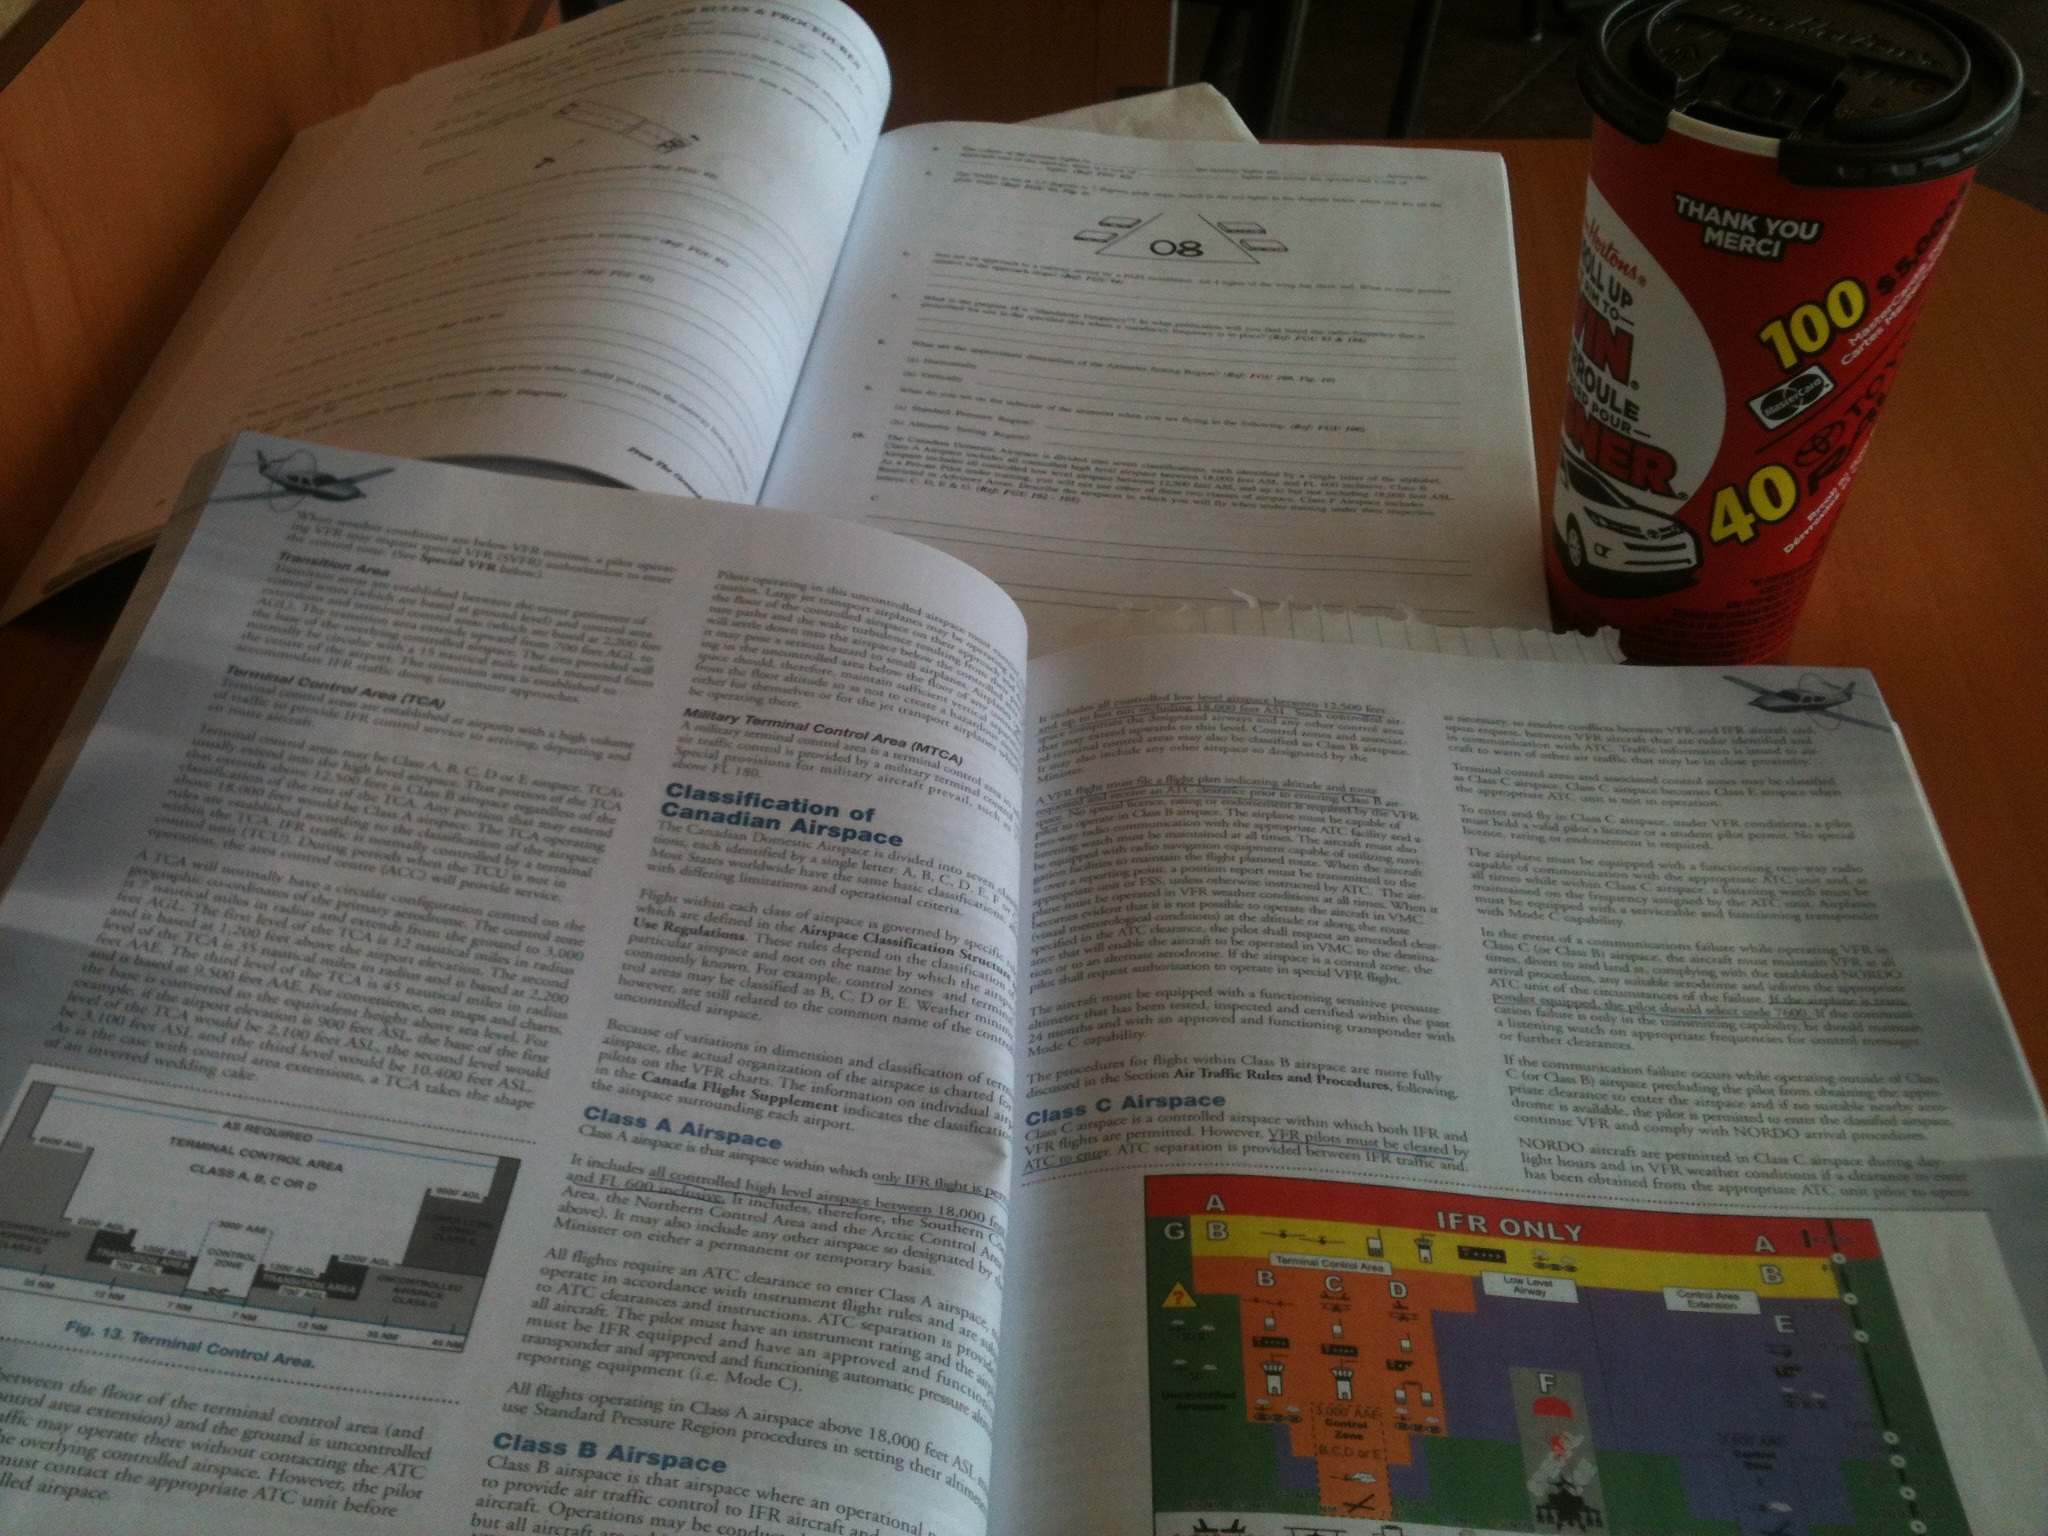
Airspace. Figure from Transport Canada (tc.gc.ca)

Terminal Control Areas (TCU): These are established at airports with heavy traffic to provide IFR service to aircraft. They may be A, B, C, D or E and usually extend into high level airspace.  The TCU takes the shape on an inverted wedding cake.  The limits are specified on the figure to the left.

Next, I’ll review the Classification of Canadian Airspace – airspace classes, A, B, C, D, E, F and G.  Read more air law here.

Posted on 3 Comments

The high key – low key landing procedure

The high key - low key landing procedure. Image courtesy of Transport Canada (Flight Training Manual)

This procedure is used to plan a forced approach in the event of an engine failure.

When we have an engine out emergency, our goal is the extend our glide as far as we can. The longer we can glide, the more time we have to evaluate our landing options and plan an approach.

Once we have established our glide and picked our field, we want to start turning into this field and planning an approach as fast as possible.  This may mean we are turning towards our field when planning which way we are going to land,  land into the wind if possible and avoid obstacles.  We are also likely doing our engine restart checks as we do this turn. This is explained in detail in the forced landing article.

Calgary VFR Navigation Chart

We should note our altitude above ground level. This means we should note the altitude on our map. In the area where I am flying is near Cremona, Alberta, the elevation is around 4000 feet.  When I start the procedure, I am at 6000 feet.  I have 2000 feet of altitude to plan my approach and landing.  Of course this is just a simulation, so when I am up with my instructor we do get within a few hundred feet of the ground, but when  practice on my own I don’t go below 500 feet above ground, which is 4500 feet.

The procedure calls to start the high key abeam the threshold where we have chosen our landing spot. The altitude we should be above this threshold is calculated from whatever gives us a two-minute turn to our left in our aircraft and our rate of descent. The turn and bank coordinator and vertical speed indicator gives us this information.  In the Cessna 172, the two-minute turn gives us approximately 700 feet of altitude per minute.  This means in two minutes we can descend 1400 feet if we use the information supplied in the turn coordinator for a two-minute turn. The FTM suggests that we use this altitude plus 200 feet of “fudge factor” to plan our altitude, meaning that we should be at 1400 + 200 = 1600 feet above ground at our “high key” position.  Where I am flying, I am planning to be at the high key at 5600 feet.

This gives me about 400 feet to reach my high key position when I am flying at 6000 feet.

The low key position will be halfway around the turn, about a minute after entering the high key turn.  My altitude should be 800 feet above ground or around 4800 feet ASL on my altimeter.

A two-minute turn shown on the Turn coordinator. Image courtesy of wikipedia.org

A good trick is to pick a landmark where you estimate will be your low key position. Look to your left when you are starting your high key. Is there a landmark that is approximately 1.5 miles from your high key spot? You should aim to be over that spot in your low key, and this will give you an indication whether or not you are in the proper spot in your sequence.

Our “final key” will be around 500  feet.  Next we are at short final where we can decide if we are too high – and hopefully we are not too low!

Some things to note: be careful of the winds, these can affect your pattern and blow you off course.  Also if you think that you are way too high, do a turning slip to loose altitude before adding flaps. This will allow you to loose more altitude.  Remember, it is always better to be too high than too low. There are ways to loose altitude – such as a slip or using flaps – but there are no ways to gain it when we have no power. Also, the reason we turn left is because we are in the left seat we have better visibility of our landing spot on the left hand side.

The high key – low key landing procedure is only one way of planning the approach. It may sometimes be that we don’t need to do the key procedure, and can just do a series of turns to bleed off altitude, fly a “bow-tie” patten, or whatever system we think is best to get us on the intended landing spot safely. This means landing into the wind when possible, avoiding obstacles, and picking as smooth of a surface as possible.

This procedure is very difficult to do even when we are planning to do it in a simulation! I can imagine that when really loose engine power the situation becomes very real very fast, and coupled with the stress of knowing you have to put your plane in a field is very intense.  This is why practicing the procedure again and again is so important: your response is automatic and you know what steps you need to go through in a real engine-out emergency.


Posted on

A review of weather reports for pilots

Mountain wave cloud from the edge of the rocky mountains

Let’s review some basic concepts in meteorological reports for Pilots.

Cloud cover: measured in oktas, or out of eighths of the sky coverage:

  • SKC – sky clear of cloud
  • Few 1-2 out of 8
  • Scattered 3-4 out of 8
  • Broken 5-7 out of 8
  • Overcast 8 out of 8 – full sky coverage

METAR: Aviation routine weather reports are coded weather observations that are taken each hour at over 200 aerodromes and other locations in Canada.

SPECI: Special Weather Reports – these amend METAR observations, whenever weather conditions fluctuate or are below criteria.  What are these criteria?

  • Sky condition: (1) the cloud ceiling height changes either up or down from 1500 feet, 1000 feet, 500 feet, 300 feet or 100 feet, or to the published IFR limits for that aerodrome. Also, (2) the first occurrence of cloud under 1000 feet is noted.
  • Precipitation
  • Temperature: if above 20 degrees, an increase of 5 degrees; or if the temperature decreases to 2 degrees or colder.
  • Visibility: up or down any of these thresholds: 3 SM, 1.5 SM, 1 SM, 3/4 SM, 1/2 SM, or the limits for the aerodrome.
  • Wind: Wind doubles to exceed 30 knots, or shifts.
  • Severe weather: thunderstorm, tornado, funnel cloud.
  • Other: these can be incidents at the aerodrome, such as an accident or a special request from a weather forecast office, or if the weather observer feels it’s just to take initiative to issue this alert.

TAF: Terminal area forecast. Limited to aerodromes where METARS and SPECIs are published.  There are about 180 TAFs in Canada.  Generally prepared four times daily with up to 30 hour validity.

GFA: Graphical Area Forecast. There are seven GFA areas in Canada, these weather charts depict the most probable weather conditions expected to occour on the ground up to FL240 (flight level 24,000 feet).  There are six charts prepared for every period, issued daily at 2330, 0530, 1130 and 1730 UTC, valid from 0000, 0600, 1200 and 1800 UTC respectively.   Each chart has 12 hours of forecasting plus a 12 hour IFR outook, giving us a total of 24 hours of forecasting.  Of the six GFAs listed for each forecast period, three contain cloud and weather information and three contain icing, turbulence and freezing levels.

The GFA can also be amended by AIRMETs or SIGMETs. AIRMETs are short term weather advisory for aircraft in flight, alerting pilots to possible hazardous flying conditions, but not severe enough to require a SIGMET.  SIGMETS  are short term warnings of certain potential hazardous weather phenomena, and are limited to more serious hazards which are important to all types of aircraft.

FDs – These provide upper level wind forecasts. They are provided for seven specific regions in Canada, and are further broken down for specific areas.  Forecast for the 3000, 6000, 9000, 12,000 and 18,000 foot levels are provided, and these are the low-level FDs. They are also given for flight levels above 18,000 feet (FL180).

Radar: Radar is provided on the Environment Canada webpage. It will show you developing precipitation. It is very accurate.

Satellite: Satellite is shown on the AWWS webpage, and is useful for long term weather forecasting and planning. You can use it to find low and high pressure systems. Recall that air rotates clockwise around a high and counterclockwise around a low.

PIREP: Pilot reports can be filed at any time. They should be regularly checked for your region. In fact, one that I received from a controller at Calgary terminal saved me from going into an area of severe turbulence.

A sample RVR for CYBW (Springbank)

RVR Index: Another great tool is the RVR index. The Runway Visual Range shows real time the current wind speed and direction at your chosen aerodrome. It is so accurate I often check it when I am already at the airport getting ready for a flight.  The image on the left it shows a sample of what you will see.  The wind speed and direction is displayed according to the magnetic compass.  Here the wind is blowing from 130 at 9 knots.  The wind direction is overlayed with the actual runways to get a sense of where exactly the wind is coming from, and if we can expect a crosswind.  In fact the cross wind component for each runway is calculated in a table next to the image.  Wind given is the average for each minute.


It is important to understand how to read these reports and understand how they are created.  After awhile, it becomes second nature.   Pilots after all, are lifetime students of weather.